
Information Center
Help Pages
Please
Note! |
What is Information Center?
Information Center is a tool by which you yourself can pick and combine data from the vast pool of information available in the our database. You decide which search criteria and filters to apply. In short you can build your own reports customised to your specific needs.
Have you ever found that one report has all the information that you need except one little detail that is in another place, or that you could not quite filter the data the way you wanted? With Information Center you chose what to include and how to filter it.
Currently you can choose to retrieve the data in HTML, Excel, PDF or XML format. Furthermore, it is possible to schedule IC reports for an automatic regular execution. In that case, the report results would be sent by email to a list of recipients you determine yourself.
The Main Page
As mentioned above, Information Center allows you to create your own reports. All your reports are accessible from the main page which displays a list of all your existing reports. It also allows you to create folders and to use them to structure the different reports you have created. In conclusion, the main page is the entry point for all your interactions with Information Center. It offers the functionality to organize reports, lets you create new reports and folders and allows you to execute, schedule, send or delete existing reports.
To learn more about the main page, its folder and sending functionalities, you may have a look at our specific help page.
A simple report step by step
Let's dive straight into building a small report...
We start with a very simple example. Let's make a simple Personnel List report. Yes, yes, we know that there is already such a report in but let's do it anyway just to see how a simple report is done.
When you open the Information Center for the first time, you will see an almost empty page. The only action you can take is to create folders and/or your very first report.
Step 1. Create the report.
Click on the New icon (see image) and you will be asked to enter a name and a description of your first report.
Once done, the new report will appear in the list. Now we want to dive into report making. Therefore select the new report press the Edit icon (see image).
This will open a new window with the Report Editor in it. We can now start editing the report.
Step 2. Add the data we need
We obviously do not want to extract all data available in one go. That would be meaningless. So we need to tell the system what data tables we need. In order to do so, we use the table selector which is in the upper left area of the report editor.
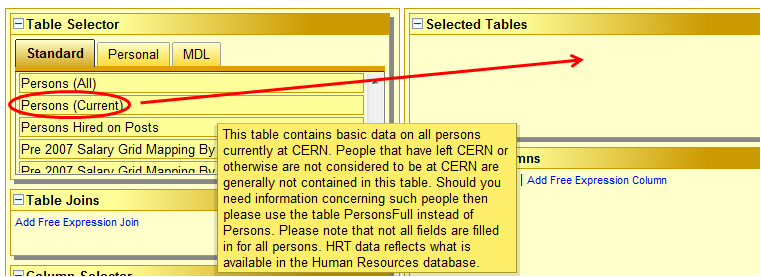
Select the table "Persons (Current)" in the table selector. You may have to use the scrollbar at the right hand side to make it appear. When hovering over the different tables using the mouse, an explanatory tooltip is displayed. There are two versions of the Persons table. One that contains only persons currently considered to be at CERN or at least having some recent contact with CERN (Persons (Current)), and one that contains everyone ever registered at CERN (Persons (Full)).
To add the table to your report, drag it to the "Selected Tables" area on the right hand side of the table selector in the middle of your window. While dragging the table, the area inside of the "Selected Tables" component becomes green, indicating that it is a valid place to drop the item you are currently dragging. Once the table is selected, it appears in the list.
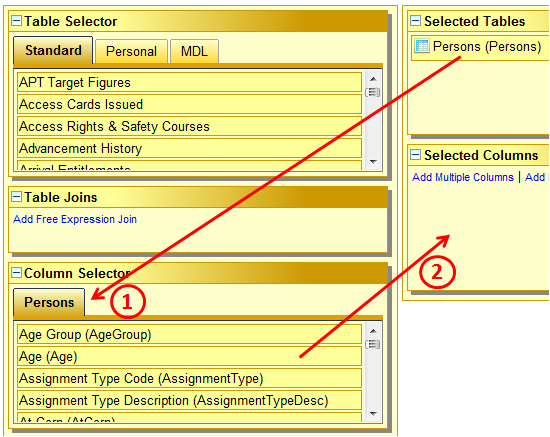
When there is at least one table selected, you can start adding columns to the report. All available columns are available in the column selector which is located in the left hand side column below the table selector and the list of table joins. For each table that has been added to the report, a tab containing the corresponding columns appears in the column selector (1):
Add columns using drag/drop
In order to add some columns to your report, scroll through the list of available columns and drag all the columns you would like to appear in your report to the "Selected Columns" panel right next to the column selector (2). A lot of columns have an attached description. It is made visible in a tooltip if you hover over the column using your mouse. If you want to add tables from different tables, you may have to switch to a different tab from time to time.
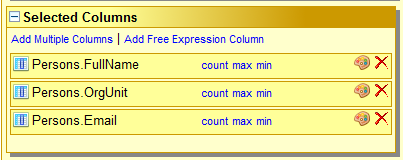
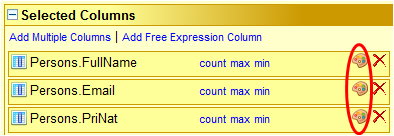
For this small example, please select the columns Full Name, Organic Unit and Email Address. Your selected columns panel should look similar to the following screenshot afterwards:
Add more columns using the "Quick Column Selector"
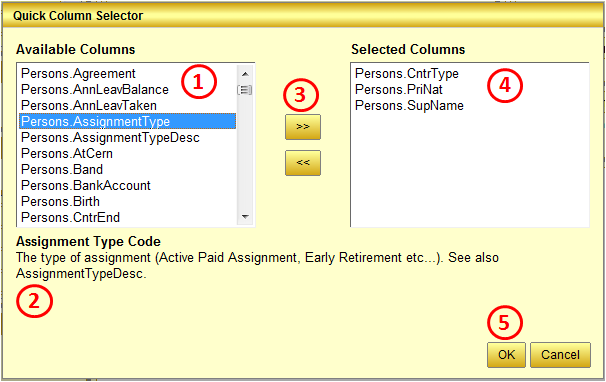
There is another way to add a lot of columns very quickly: When clicking the small blue link "Add Multiple Columns" (see above screenshot), a small dialog opens itself. It provides access to all selectable columns. In the list, you can select the columns you need (working with the Shift and/or Ctrl keys to select multiple columns at once), push them into the right hand side list box and add them to your report by clicking "Ok".
Please add the columns Contract Type, Primary Nationality, Superior Name to your report using this quick column selector. In the left hand side list box (1), all available columns that have not yet been selected in the report are available. Below (2), the label and a short description (if available) is shown. The shown description always concerns the last selected (blue) column in the above lists. To select columns, move them to the right hand side using the button ">>" (3). All selected columns appear in the second list box (4). To confirm your choice, click the "Ok" button. To go back without selecting any column, choose "Cancel".
Reordering columns
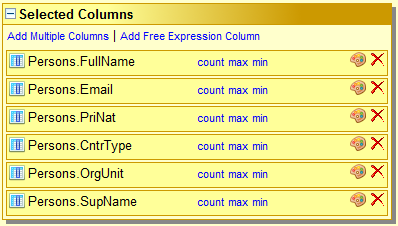
When all the columns are selected, you can reorder the columns by using drag/drop. Reorder all your columns, so that the columns, you have selected in your report appear in the following order:
Step 3. Format the data
Having selected the necessary columns, you can now choose to format the output. You can choose from the following formatting possibilities:
To format a column, click on the formatting icon (the colour palette) on the right hand side of each column:
- You can make the text appear in Bold
- You can make the text appear in Italics
- You can choose the colour of the text in the column
- You can choose the colour of the background of the column
- You can choose from additional formatting options for numbers and dates depending on the actual column value
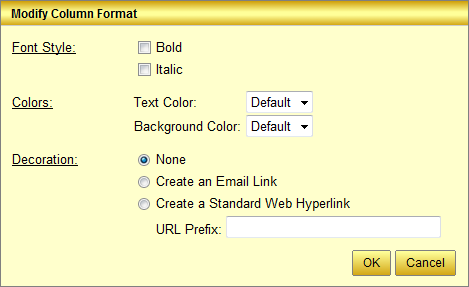
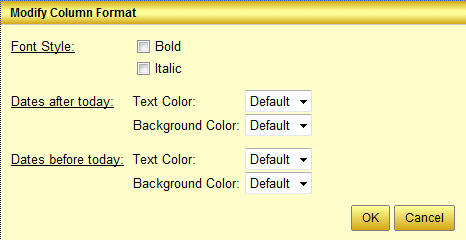
This will open the formatting dialog. The options that are available in this dialog depend on the column type. Below, the first dialog is intended for columns containing text:
The font style options are available for all column types. To make the content of a column appear in bold and/or italic, check the corresponding check boxes. For text columns, it is possible to specify a unique specific text foreground and background colour. The selected colours will be applied to all values of the formatted column.
Furthermore, it is possible to make a column value appear as a link. Either, if your column contains email addresses, you can select the option "Create an Email Link" to create a "mailto:" link considering the column value as email address. Another possibility is to create a standard web link using the third option "Create a Standard Web Hyperlink". If you use this option, the column value will be rendered as a hyperlink. By default, if no specific URL prefix is defined, the column value will be used as link as it is returned from the query. In order to compose a link based on a specific URL using the actual column value as suffix, supply a link (e.g. an address like "https://edh.cern.ch/Document/") to which the column value is then appended. This can be very useful for instance to link to EDH documents.
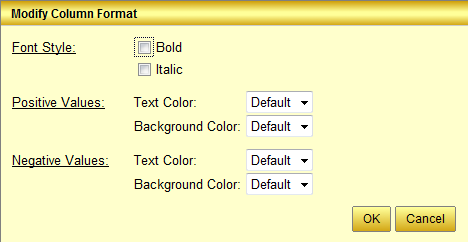
For number and date columns, the dialogs offer slightly different formatting options:
For number columns, the text and background colours can be specified separately for positive and negative values.
The same applies to dates. For them it is possible to specify different colours for dates being greater than today's date and those being smaller.
Step 4. Filter the data
Actually we do already have a report that we could run if we wanted. However this report would return all persons at CERN which is not what we want. Therefore the following section describes how to apply filters to the selected data.
Let's start by putting a filter on the organic unit. There are two types of filters:
- Dynamic conditions will create a search field which can be filled in when running the report.
- Static conditions are fixed and the user who runs the report cannot modify them. They can only be changed by opening the report in edit mode.
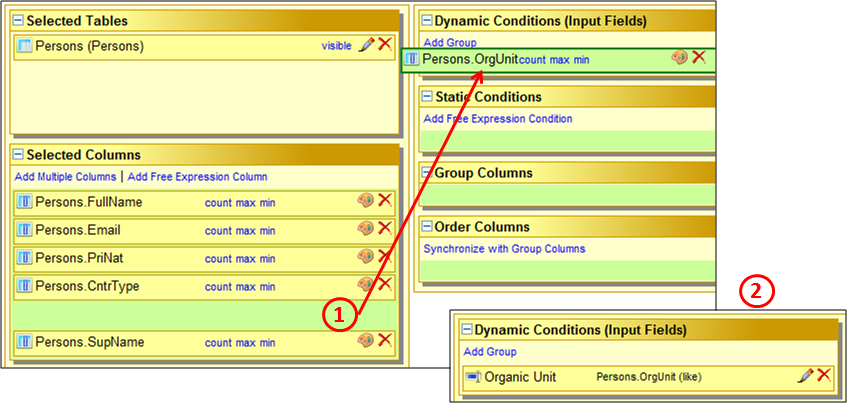
To create a dynamic condition that allows us to filter the displayed data by organic unit, drag the column "Persons.OrgUnit" to the list of dynamic conditions:
While dragging the column to the list of dynamic conditions, other areas on the report editor screen become green. This is normal and indicates that you could drop the dragged column onto these areas, too. To create static conditions, group or order by columns, you proceed in the same way. You simply drag the desired columns to the specific destination areas.
Once the column dropped on the destination area (labelled "Dynamic Conditions (Input Fields)"), a new dynamic condition appears (see 2 in the above screenshot). This dynamic condition uses the column label as label for the generated search field. Any value entered into the search field will be compared to the data in the column "Persons.OrgUnit" using a LIKE operator. I.e. when a user types in "IT", he would not only see all the persons directly attached to the IT department and not to any group but all those whose organic unit starts with "IT".
5. Run the report
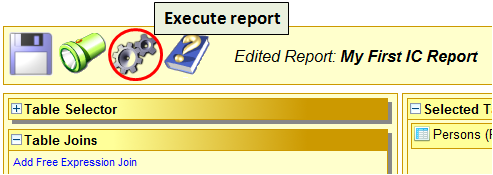
We have finished our first simple report. It can now be executed by clicking the wheels icon in the button bar at the top of the report editor:
Once clicked on the "Execute" icon, the report will be saved and validated. If there are no errors, it will be executed in a new window. As you can see the result is a report that feels and works just like any other report.
You have a normal column selection and ordering button and you can choose between HTML, Excel, XML and PDF output formats.
The Organic Unit filter (condition) that you added will show up as a input field and Information Center will automatically know that the field should contain an organic unit and will validate whatever content is entered in the field. If the entered value does not correspond to an organic unit, you will get an error message when trying to execute the report.
6. Let's do something more complicated
We have prepared two more step by step tutorials.
- A Pivot Report using more than one table.
- A Training List using advanced expressions (Note, SQL knowledge is required for this tutorial).
Information Center Manual
For those of you who want to know more we have also produced a reference manual.
Charting
It is possible to create reports with charts. Charts are supported in non-pivot reports for the output formats HTML and PDF. You can even schedule reports containing a chart and have their results (incl. the chart) sent in an email to you. To learn more about charting have a look at the following dedicated charting page.
Scheduling of Reports
It is possible to define an Information Centre report and to have it executed automatically in regular intervals. The results of the report executions are sent by email to the people requiring them. An online help for the report scheduling functionality exists here.
I have some questions
A page of Frequently asked Questions and Answers is also available.