Reports
Report Form
This help page describes the main aspects of a typical CET report using the new user interface (introduced at the end of 2008). The following screenshot shows such a report form:
Form elements
There are several elements in the above form that merit a more in-depth explanation.
The header bar of the report consists of:
- The application icon which is clickable and links to the application desktop.
- The name of the shown report as well as the name of the currently connected user and the current date.
- A field containing application specific status information. In the case of CET this is e.g. the date of the last successful data extraction.
The central part of the form consists of:
- A link to the application's services menu at the top right corner.
- Several foldable sections containing input fields that are used to specify the search criteria.
- In some reports there is a section labeled "Custom Query Input" which contains a special input object allowing to build more complex queries.
The bottom part of the form allows to control common report aspects and consists of:
- Controls to determine the output format and to specify other layout specific settings.
- Some buttons that allow to store a report, to display the column or ordering selector, to reset all input objects on the form and to actually execute the report.
- In a couple of reports there is also a pivot column selection control.

Services Menu
In the top right corner of the report form just below the header bar, there is a small link called "Services". By clicking the link, a small menu is opened. This menu serves as entry point to the most important application services and is reachable from most parts of the application. It allows you to quickly reach key services you may want to use when working with the application.
Report Folder
Allows accessing all stored reports of the connected user. From the report folder, existing stored reports can be launched or edited. From there, stored reports may also be scheduled for an automatic execution.
Virtual Unit Editor
The Virtual Unit Editor allows to view, modify or delete existing virtual units or to add new ones. Virtual units allow you to group together information that otherwise would be separate and require either multiple report executions and/or the use of multiple search fields. It is especially useful for scenarios where the same search criteria are used again and again and potentially also in different reports.
Information Center
The Information Center allows you to create your own simple reports targeted at specific purposes for which no standard report is available in HRT.
Preferences
In the preferences screen it is possible to customize certain aspects like the presentations of dates or numbers in the report results. It also allows you to switch off showing help panels automatically when passing over the search fields with the mouse.
Session Information
The session information screen shows who is the currently connected user and what are his access levels.
News
Allows to view the latest news concerning the different MDS applications.
Help
Link to the general application help pages like e.g. the one you are currently reading.


Fold Sections
Collapsing and expanding folds
A report form's input objects are grouped together into different fold sections. Each of these sections can be opened (expanded) or closed (collapsed) by using the "plus" or "minus" icon on the left hand side of each fold section's title.
When a fold section is expanded or collapsed, its state is saved by the application server and the next time you come back to the same report, the fold sections will appear in the same state you last left them.
Input fields
Input fields let you specify the search criteria for the data you want to obtain from the report. You can enter values into one or several fields using the search screens or just type them in directly.
In certain types of input fields you can also type the names of your Virtual Units. Some types of input fields allow entering lists of values, separated by commas (e.g.
"ALICE, AD-4" for experiments). It is then possible to include Virtual Units among the values in the list (e.g."CMS, MY_EXPERIMENTS" , where MY_EXPERIMENTS is your Virtual Unit).Another set of fields accepts ranges of values, which are specified by giving the lower and the upper bounds separated by a colon (e.g.
"47111:47114" for budget codes). Ranges can be open-ended, in such case a default lower or upper bound is used. For instance":47114" results in the selection of all budget codes from the beginning of the scale up to "47114". Specifying"47111:" is equivalent to selecting all the codes above "47111" inclusively. Be aware that by using open-ended ranges you may select a wide set of data and in turn produce a resource-demanding query.Ranges and lists of values may be used together by including the range in the list (e.g.
"AD-4:ALICE, CMS" for experiments). The last example matches all experiment names that when ordered alphabetically are between"AD-4" and"ALICE" inclusively as well as the"CMS" name. Several ranges can also be specified, provided that they are separated by commas. However, it is not possible to specify ranges of virtual units, since such expressions do not have an interpretation in the general case.Question mark: context specific help
On the right hand side of most input objects, there is a question mark icon which gives you access to short online help concerning the associated input object. The help screen is opened as a popup in a separate window.
Search screens
 screen")
Some input objects have a clickable label. When clicking on such a label a screen similar to the one shown on the left hand side of this text is shown. Such a screen (also called "list of value" (LOV) or search screen) offers the possibility to search for the exact term (e.g. a person, an organic unit, a budget code, an experiment etc.) if you only know a part of it.
In the search field, you are allowed to use wildcards (the asterisk sign "*") to match several characters. The "Search" button launches the search and the "Insert" button or a double click on a line in the results list send a value from the search screen to the corresponding input object.
In some cases, it is allowed to select multiple values and send them back to the demanding input field. In such a case, multiple values can be selected from the search screen's results list by using Ctrl/Click or Ctrl/Space.

Form Controls
Output format selection
In most reports, there is the possibility to select a specific output format. By default the output of a report is generated as HTML. Other output formats that are widely available are Excel, XML and PDF. In some reports you may find very specific output options, e.g. related to different chart types that may be offered.
To change the output format, select the desired format in the dropdown list at the left hand side of the report controls section as shown on the left.
Borders and "No Form"
The "No Form" input field allows to choose between showing or not showing the report form when the report results are shown in the HTML format. If the checkbox is checked, the report results will be shown directly below the report header and the form will not be available on the page.
The "Borders" checkbox allows switching the display of borders in the results table on or off. The selection is applied to the HTML output format and in most cases also to Excel. However, the rendering of other formats like e.g. PDF or XML is completely independent from this setting.
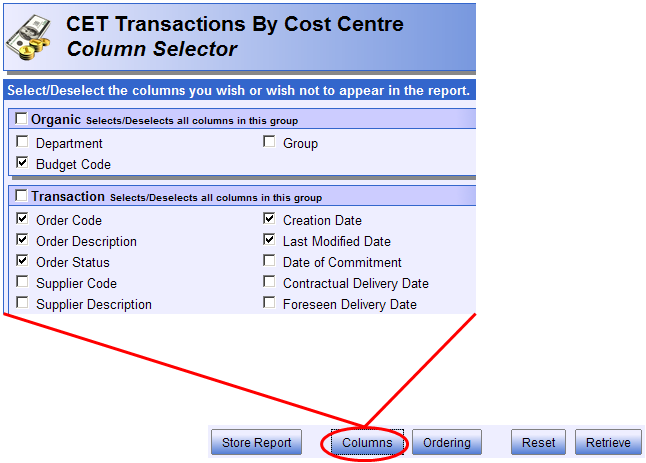
Column selection
By pressing the "Columns" button, it is possible to make the column selector screen appear (illustrated in the above screenshot). There you find a list of columns that are available for selection. Choose the columns you would like to appear in the report results and close the column selector popup window by pressing "Ok". In the case, you want to cancel your column selection, either close the popup window or click on the "Cancel" button. In order to return to the default column selection, you can use the button "Default Columns" at the bottom left corner of the column selector window.
Ordering selection
When the button "Ordering" is clicked, a popup window with a layout similar to the one shown above is opened. The numbered parts of the screenshot are explained below. In short, this screen allows you to move the columns you want to order by from the left hand side list to the right hand side list - either by using drag/drop or the green buttons in the middle.
1) The first list shows all columns that are available for ordering. They can be dragged over to the right hand side list or selected and moved by clicking on the button with the green arrow.
2) In the right hand side list, all the columns that are currently used for ordering are listed. The order of the columns can be modified by using drag/drop.
3) The little green arrow next to each ordering column indicates whether the column is used for ordering in ascending or in descending order. The order direction can be changed by clicking on the text "ASC" or "DESC".
4) When pressing the green arrow button, all columns that have been selected in the "Available Column" list are moved to the "Order By Columns" list. In order to select a column, simply click on it. It will then get a grey background to indicate its selected state.
5) The "dustbin" button removes any selected column from the "Order By Columns" list and makes it available again in the list on the left hand side.
6) Potential error messages will be displayed here. An error message may be displayed if more columns than allowed are selected or if the order the order by columns have been put into is not acceptable for the report.
7) Once you are happy with your column selection, you can commit your changes using the "Ok" button. To cancel all your changes you can close the dialog by using the "Cancel" button.
Ordering selection using the context menu
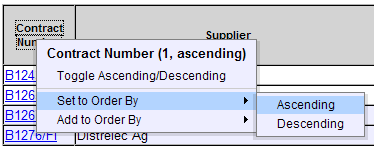
In most non-pivot reports, it is also possible to influence the ordering by using the context menu which is available when clicking at the header of the report results table:
If you right-click a column header in the results table, you are presented with a context menu. If the column you clicked on is already used for ordering, you will see in which order position it is used and whether the order direction is descending or ascending. Then you also have the possibility to toggle between ascending and descending ordering.
Otherwise, if a column is allowed to be used for ordering, you have the possibility to set it as order column ("Set to Order By"). This will erase any existing order column selection and choose the selected column as only order column. If you want to add the column as an additional order column, you should select "Add to Order By".
In the case that a column is not allowed for ordering, the two latter menu entries are disabled and cannot be selected.
Pivot column selection
In reports offering the possibility to group the results using horizontal (row) and vertical (column) groupings, an additional button labeled "Grouping Layout" is available. Using this button, you can open the pivot selection screen which looks like in the screenshot just above.
1) In the list "Available Columns", all the columns that are selectable as pivot columns are listed. From there they can be dragged to the two other list boxes. Alternatively, you can select the columns you are interested in moving to the two other list boxes and have them moved to the two other list boxes by using the two green arrow buttons on the right hand side of the list.
2) In the upper right list box, the columns, that are used for column grouping (X-axis of the results table), are listed. Their order can be changed by drag/drop.
3) The list box at the bottom (middle) contains all the columns that are chosen to be used as column groupings (i.e. they appear on the Y-axis of the results table).
4) The green arrow pointing to the right moves any selected column from the "Available Columns" list box to the upper right list box that contains the column (X) groupings. Columns are moved to the bottom list box which lists the row (Y) groupings by using the button with the green arrow pointing downwards. Any column that is selected in either of the two right hand side list boxes can be moved back to the "Available Columns" list box by using the "Bin" button.
5) In addition to the selection of grouping/pivot columns, it is also possible to select the totals you would like to appear in the report results. Depending on the current selection of pivot columns, severable checkable options are available. The most common option is "Grand Total" which displays one big total line at the bottom of the results. If you have selected some column groupings, the option to show right hand side totals is also available. Otherwise, depending on the number of row (Y) grouping columns additional options to show sub-totals for the first or second grouping criteria are also available. If you require a more advanced set of sums, you can switch to the expert mode by clicking on the blue link above the check boxes.
6) If you want to have more control over the displayed totals and have some background knowledge about group by SQL queries, you may want to switch the totals selector into expert mode.
Depending on the number of available groupings, a single pattern is represented by a sequence of 'N' and 'Y' characters. In the given example, a sequence of three 'Y' represents the grand total, meaning that the sum for all three group criteria available in the pivot control's 'simple mode' should be shown. The pattern 'NYY' represents the sub total for the first grouping criteria. It means, that for every value of the first grouping criteria (N = no sum), the combined sum of the second and third column shall be displayed. The pattern 'NNY' means that for every combination of the first and second grouping criteria, a sum shall be shown. The length of each pattern composed of 'Y' and 'N' characters must have a length of as many characters as group by columns have been selected.
All chosen sums are separated by commas and in order to find the settings that fully suit your purpose, it is advisable to play a bit with the different combination possibilities.
7) Potential error messages will be displayed here. Errors may occur if too many columns are selected or if there is not at least one grouping along the Y axis (bottom list box).
8) The different settings you have made can be committed by clicking the "Ok" button. By using "Cancel" all changes are lost and the pivoting settings remain in the state they were before the pivot selection screen was opened.
Storing, resetting and executing reports
1) The "Store Report" button opens a popup window that allows you to save the criteria you have entered for the current report. This enables you to re-execute the report with the same set of criteria at any moment by launching the report from your report folder (the place where all your stored reports are saved). Storing the search criteria is also necessary in order to schedule a report for an automatic execution.
2) Resetting the report clears all search fields as well as possibly shown results and reloads an empty report form.
3) In order to launch a report - so that some results are fetched - you have to use the "Retrieve" button. When launching a report, a performance analysis is executed first. You will only notice it, if the analysis reveals potential problems. In that case a small screen is presented:
If you see this screen, it means that HRT thinks that the query criteria you have provided are not sufficient to execute the report guaranteeing an acceptable performance. You should then consider specifying more criteria and re-executing the report. If the report is in a state that it exactly has all the criteria you want and you get the above warning, you can always opt to execute the report anyway by clicking the "Execute this query" button at the bottom of the warning message. Note that in such cases report execution times could be extremely high!