
SMT Reports
SMT contains a number of reports for various purposes. It is however, two of these reports that are of most interest for the majority of cases. The Simulation Pivot (Summary) and the Simulation History.
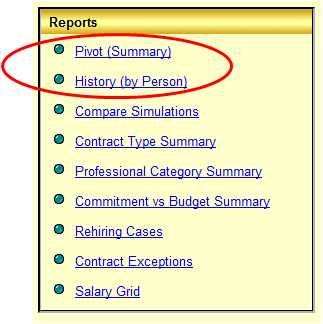
Both reports are located in the "Reports" box of the SMT menu.
A quick description of the different reports follows:
-
Simulation Pivot
The main report for presenting simulation data. Use this to slice and dice the information as you wish. -
Simulation History
Shows the simulated "history" for a individual person. With this report you can see which decisions the simulation has taken with respect to the persons career at CERN. -
Compare Simulation
Compares two simulations and highlights differences in FTE or cost. -
Contract Type Summary
Displays the evolution of the contract type (IC/LD) ratio. Data can be presented in tabular form as well as a graph. -
Professional Category Summary
Displays the evolution of the professional categories (1..5c). Data can be presented in tabular form as well as a graph. -
Commitment vs. Budget Summary
Compares the budgets (target figures) in FTE and CHF maintained by DG-RPC with the figures generated by a given simulation. -
Rehiring Cases
Displays any rehiring cases that are registered in the HR database. -
Contract Exceptions
Displays all contracts where a fixed contract length have been registered in the HR database. -
Salary Grid
Displays the current salary grid. Displays both the reference salary and the cost in CHF. -
Parameter List (part of the box "Administration")
Displays the current parameter settings for a given simulation. -
User Data List (part of the box "Administration")
Displays the currently entered user data for a given simulation.
SMT Report Specifics
The reports in SMT work like any other reports in HRT. Below is an example of the Simulation Pivot report:
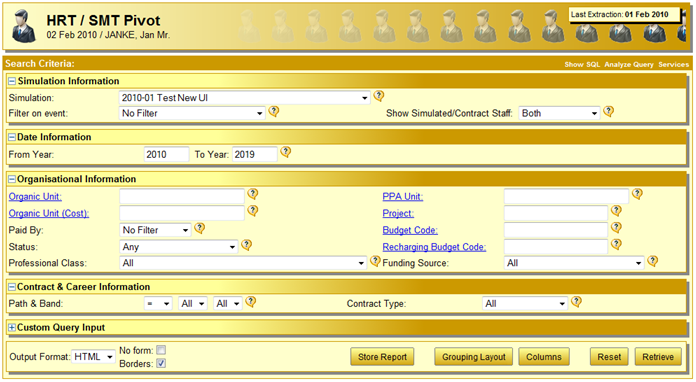
There are however a few specific points that should be mentioned:
Which Simulation?
![]()
Since you may have many simulations you must choose for which simulation you want to execute the report. This is done via the simulation drop down at the top of each report.
Attachment Organic Unit versus Costing Organic Unit
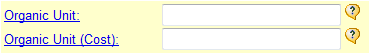
As is discussed further in Basic Concepts you must make the distinction between attachment organic unit and costing organic unit.
Filtering on Events
![]()
Filtering on events allows you to either count the number of a specific event or to filter out people that have received a certain event during the last simulation run (e.g. this allows you to quickly display all the people having received an IC during the simulated period).