
Information Center
User manual
This reference manual will describe each of the different parts of the Information Center report editor in detail. If you are new to database concepts you should probably first have a look at the Step by Step tutorials provided on the main Help Page.
Please note that some functions of the Information Center allow you to enter free SQL expressions. This requires you to have some knowledge of databases, queries and the Structured Query Language (SQL). It is beyond the scope of this text to describe these concepts here.
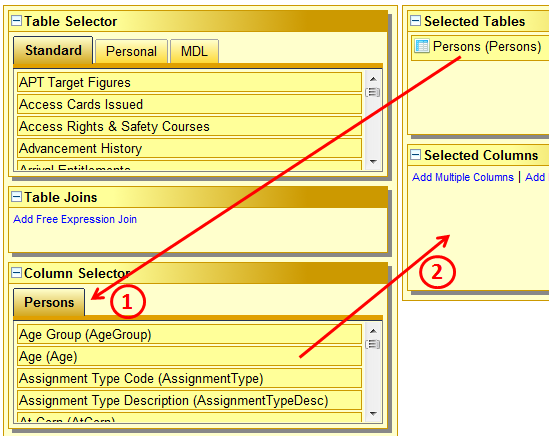
Table selector
The table selector allows you to choose from the different tables containing data. Each table contains data for a specific purpose such a general personnel data, access rights, historical data, costing data etc. etc.
Most people will only see one tab (Standard) in the table selector. Depending on your specific working needs and access rights, additional tabs (Personal and MDL) may be available. The tab "Personal" contains all table definitions that are created online using the IC Table Definition editor. Users having access to the MDL (Management Data Layer) data, will see the tab "MDL". In most cases, you only need the tables that are provided in the "Standard" tab.
If a table has an associated description, hovering over the table shows a this short description in a tooltip.
Once you have decided it's the table you want, you just drag them to the list of selected tables on the right of the table selector. You can select multiple tables by selecting them and moving them one by one. If you select the same table more than once, numbers are added to the table's alias in the list of selected tables.
Once a table have been added to the report you can change the name by which you will refer to the individual columns of this table by clicking the small pen symbol to the right of the table. Although the default names are usually sufficient this feature can sometimes be useful, especially when including the same table twice which is sometimes necessary in advanced report. It also allows you to shorten the names. Short names are handier when working with a lot of free SQL expressions.
If you select more than one table the Information Center needs to know what relationship exists between the tables. They need to be joined together. The next chapter discusses this functionality in Information Center.
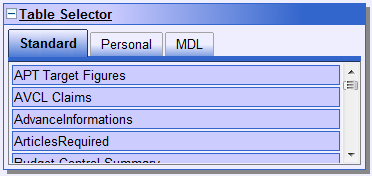
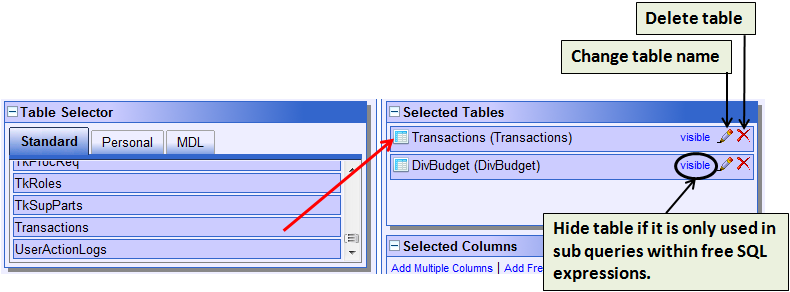
Table joins
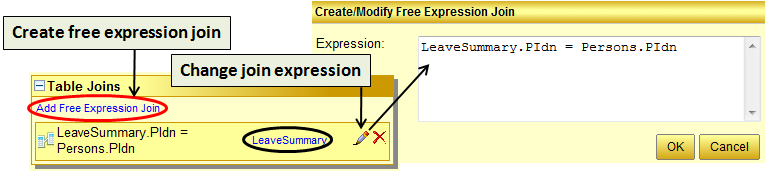
The Information Center generally provides - in the most common cases - a default relationship (join) between the tables that have been selected. If no join is created automatically, the user should create a join by himself. This is done by dragging columns from the column selector onto the table join component.
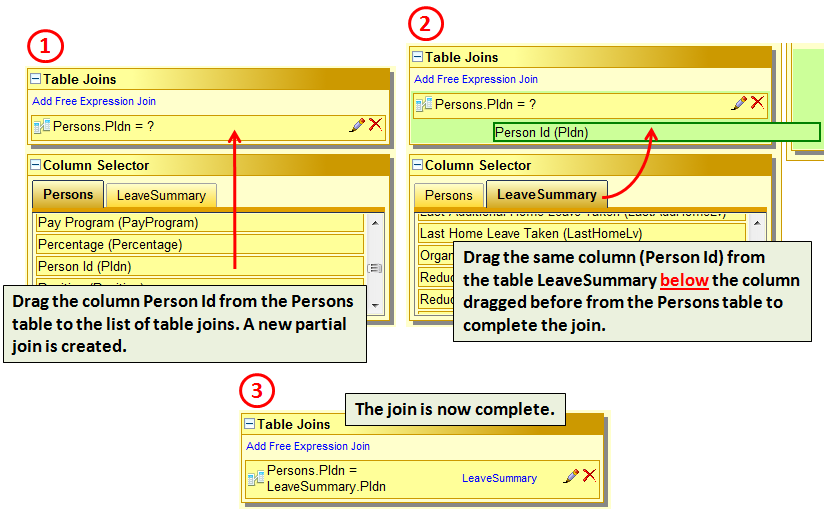
As illustrated above, a join is created manually by:
- dragging a column from the first table onto the table join list. A partial join is created.
- Then switch the column selector to show the columns of the second table and drag the column you would like to use in the join just below the column from the first table in the join list.
- Now the join is completed. You can edit it, change the table that drives it or delete it again.
You can delete a join using the
icon (careful, you should generally not have un-joined tables since this will cause most queries to be excessively slow and returning unwanted results) and you can change the join expression by clicking the
icon.
Selected columns
The "Selected Columns" component is where you specify what information you whish to present in your report and how. Once you have specified which tables you wish to use you would then normally proceed with the selection of columns.
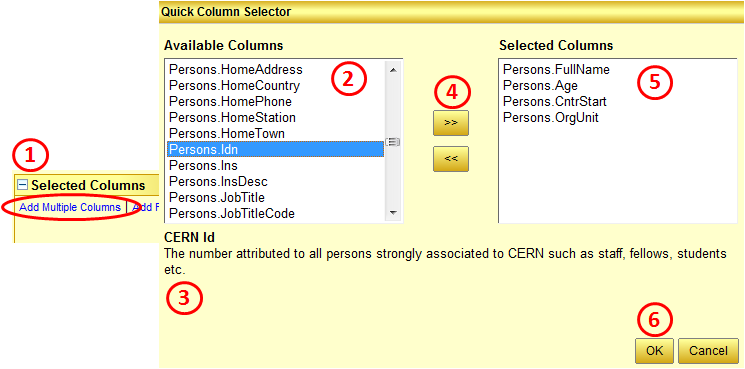
Columns are selected by dragging them from the column selector onto the list of selected columns or by selecting them using the quick column selector which is accessible via the blue link "Select Multiple Columns":
The above illustration shows how to proceed when dragging columns from the column selector onto the list of selected columns. Below it is shown how the same is realised using the Quick Column Selector:
The Quick Column Selector is opened by clicking on the blue link (1). In the left hand side list (2) you see all the columns that have not yet been added to the report. In the area below the lists (3), the label and a short column description (if available) is shown. All the columns, you want to select should be transferred to the right hand side list box by using the move right button ">>" (4). All columns that will be added to the report are shown in the right hand side list box (5) in the order they have been added. By clicking "OK" (6), the chosen columns will be added to the report.
One you have selected your columns they will appear in the Select Builder.
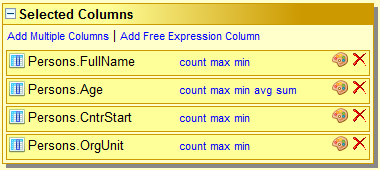
You can now modify you selection in several ways. The order of the selected column can be modified by dragging the columns up and down. The order in which the columns appear in the list is also the order in which they appear in the report with the exception of any grouping or ordering columns which will always appear first.
You can also apply an Aggregate Function. An aggregate function is a mathematical function that is applied to the value of the column when data is grouped into categories. Depending on the type of the column you can choose between:
COUNT - The number of values. For instance the count of the column Persons.PIdn would give you the number of persons.
MAX - The maximum value contained in the chosen column in numerical or alphabetical order depending on the column type.
MIN - The minimum value contained in the selected column in numerical or alphabetical order depending on the column type.
AVG - The mathematical average. Only available for columns that contain numbers.
SUM - The mathematical sum. Only available for columns that contain numbers.
To apply a aggregate function just click on the desired function next to each column. When using aggregate functions you must group by one or more columns (see below) or apply an aggregate function to all of your columns. The grouping defines over which value set the aggregate function applies. Let's take a few examples:
Using the COUNT aggregate function on Persons.PIdn and grouping by Persons.Department will give the number of people in each department.
Using the MAX aggregate function on LeaveSummary.AnnualLvBalance and grouping by Persons.Group will give the maximum annual leave balance for a person in each group.
Using the SUM aggregate function on LeaveHistory.Duration and grouping by Persons.PIdn will give the total duration of leave for each person.
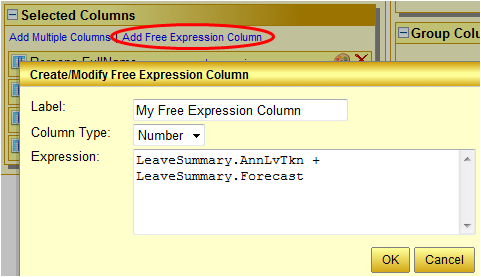
To the list of selected columns, you can also add a "column" that is a free SQL expression. For instance the leave balance could be a function of the allocation minus the taken leave. Adding a free expression column is achieved by clicking on Add Free Expression Column. This of course requires basic knowledge of SQL.
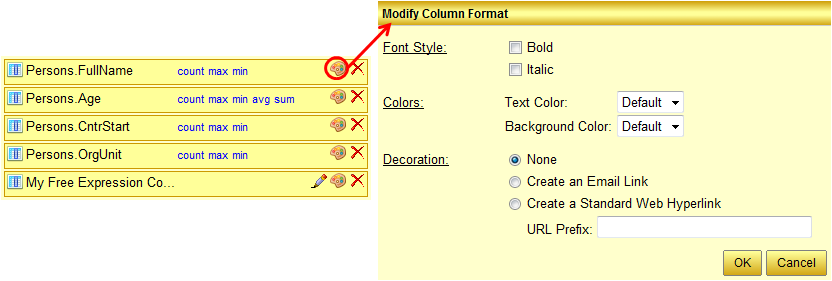
Column formatter
The Column formatter is where you specify colours and styles to be applied to the information presented in your report. Once you have specified which columns you wish to use you may then proceed by using the column formatter to choose formatting for each individual column.
Clicking on the format button for a column opens the Column Formatter and allows you to specify how that column should be formatted. The various formatting options available depend on the type of column.
For 'STRING' columns, you may specify the font colour and background colours to be used to display the column information as well as choosing to use bold and italic text styles. You can also choose to turn a column's text into a user clickable hyperlink or email link.
Create an Email Link: If you wish to create an email link, you need only select the radio button next to the 'Create an email link from this column' label. Note that a column formatted in this way must of course contain valid email addresses for this to work. Create a Standard Web Hyperlink: If you wish to create a hyperlink, you should select the radio button next to the 'Create a Standard Web Hyperlink' label and must additionally enter a URL prefix to be used to construct the hyperlink in the input field labelled 'URL Prefix:'.
The prefix that you enter will be used to construct the URL for the link and the column value will be placed directly after it. For example, to create a hyperlink using a column which contains an EDH document number you should enter a prefix of the form http://edh.cern.ch/Document/ the system will then follow this prefix with the document number, creating a valid link to EDH with the given document number from the column.
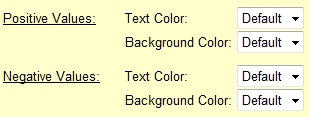
For 'NUMBER' columns, you may separately specify the font colour and background colours of positive and negative values to be used to display the column information as well as choosing to use bold and italic text styles.
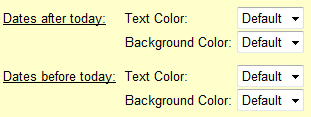
For 'DATE' columns, you may separately specify the font colour and background colours of dates which occur in the past (relative to the current date at the point of execution of the report) and dates which occur on or after today's date (relative to the current date at the point of execution of the report) to be used to display the column information as well as choosing to use bold and italic text styles.
Conditions
There are two ways of specifying conditions. A condition can be either a Dynamic Condition in which case you are expected to enter the criteria value when you run the report, or a Static Condition where the filtering criteria is entirely decided when you design the report.
Dynamic conditions
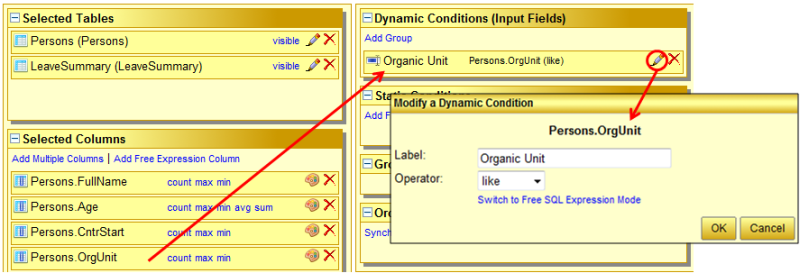
To add a dynamic condition, drag a column from the column selector or the list of selected columns onto the list of dynamic conditions. A new dynamic condition will be created with default settings. The label will be taken from the dragged column and for string columns "LIKE" will be used as default operator. By clicking the pencil icon on the right of each dynamic condition, you can change the label and the operator or enter a free SQL expression.
You have a number of operators at your disposal. The normal operators =, <, > etc. are standard operators that behave as one can expect. The like operator allows you to search for partial values.
As an example, if you would use the equal (=) operator on the organic unit field in the example image to the left, the value you would later enter would be used for filtering with exact matches. That would mean that by entering, for instance, GS-AIS as an organic unit everyone attached directly to GS-AIS would be retrieved but not the people attached to sections in GS-AIS. Using the like operator would cause the filter to match anything starting with GS-AIS and thus also retrieve GS-AIS-MDS, GS-AIS-EB etc.
When the report is run, Information Center will generate validations on the data entered by the user based on the column used for filtering. For instance, if you make a filter on Persons.PIdn, Information Center will generate a form field where you can enter names, CERN id's, Person Id's etc. in the same manner as for similar fields in conventional reports.
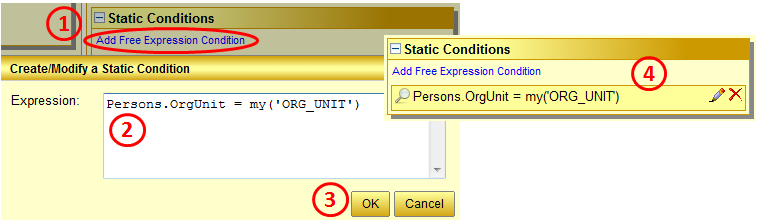
Static conditions
Static Conditions are similar to dynamic conditions except that you enter the criteria value directly in the Report Editor and will not be asked to supply a value when you run the report. To create a static condition, you have to choices: You can either drag a column from the column selector or the list of selected columns to the list of static conditions or you create a new free expression condition.
It is possible to use special condition constructs referring to the user that runs the report by making use of my() and my_role_target() functions. They are explained below:
"my" expressions
If you want to execute a report dynamically, it would be nice if the report results would be adjusted dynamically according to the user who runs the report. For instance, if a report is executed for all section leaders of the group 'GS-AIS', it would be nice if every section leader only receives the data (e.g. the persons working in his section) directly concerning him.
This is possible by using "my" and "my_role_target" expressions. The standard "my" expression which is described in this paragraph is replaced with the organic unit, the Person or the CERN ID of the user for which a report is run:
The above static condition is part of the Information Centre report which is scheduled for all the section leaders. For each individual section leader, the condition my( 'ORG_UNIT') would be resolved differently. I.e. the section leader of GS-AIS-MDS would see only the people being attached to his section, whereas the SL of 'IT-AIS-EB' would only see the people working in the EDH team.
The following my() expressions are currently supported:
my( 'ORG_UNIT' ) refers to the organic unit of the user running the report (returns a string).
my( 'PERSON_ID' ) refers to the Person ID (also called HR ID) of the person running the report (returns a number).
my( 'CERN_ID' ) refers to the CERN ID of the person running the report (returns a number).
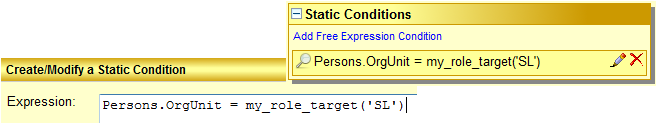
"my_role_target" expressions
Another possibility to specify conditions is the use of the "my_role_target" keyword. This expression resolves to the target of a role the person, that runs the report, currently has. Let's take the following example expression:
The expression is translated to: Get all persons where the organic unit is equal to the unit I am the section leader of. Instead of specifying 'SL' any other valid official CERN role could be specified. However, you should be aware that the report execution will fail if the person executing the report does not have the indicated role.
Grouping selector
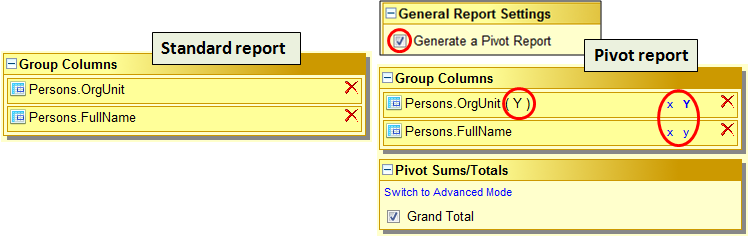
Grouping is used together with Aggregate Columns and when making a Pivot report. You simply select the column(s) you whish to group by dragging select columns over to the list of group columns. When running a report that has grouping columns, these columns will always appear first (leftmost) in the report.
Group columns in a standard report do not offer any further configuration possibilities. They can be reordered by drag and drop if required. If the report is switched to be a pivot report, there is however an additional setting to be made. Switching a report to be a pivot report is done using the checkbox "Generate a Pivot Report" in the general report settings component on the left hand side of the editor window. As soon as the pivot checkbox is ticked, the list of ordering columns disappears and is replaced by the "Pivot Sums/Totals". A pivot report generates the button "Grouping Layout" when a report is run. Using this button, the pivot selection control is available and all columns that are selected in the "Group Columns" list are available for selection there.
By default only the columns to which a layout (X or Y) has been applied will be used for grouping. All other columns can be selected just prior to running the report. In order to be able to execute an IC pivot report, at least one group column must be set to be laid out on the "Y" axis. Y stands for row groupings and X for column groupings. HRT/CET pivot reports always require at least one Y grouping and support then up to 5 more groupings on either axis.
More information about pivoting and the pivot sums/totals selection is available here.
Ordering selector
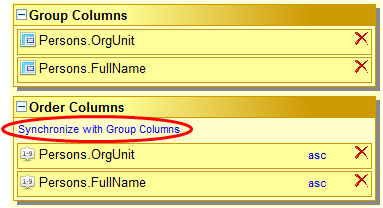
Ordering (or sorting) is a mean by which you can define the order of the data that is retrieved. The ordering selector works in the same way as the grouping selector but it does not have the additional pivot layout controls. You create new orderings by dragging select columns onto the list of ordering columns.
If you have already created some group columns and your report is not configured to be a pivot report, it is easy to synchronize the current group column selection with the orderings.
All newly created orderings will be set to order in ascending order (i.e. from A to Z or from 1 to 9). In order to switch the order direction to be descending (Z-A, 9-1), click the small blue text "asc" and the ordering will be immediately changed to be of type "desc".
The ordering specified in the Report Editor will be the default ordering for that report. The ordering can be changed later when running the report using the ordering selector.
When a maximum of three ordering columns is set for the report, a column selector will be available. If more than three ordering columns are selected, no column selector is available and the ordering is fixed to whatever has been set when configuring the report using the IC report editor.
General report settings
There are a few general report settings that can be made.
Generate a Pivot Report
A pivot (or sometimes called a Crosstab) report is a report where the data can be grouped and pivoted around the X and Y-axises of a grid. Examples of Pivot reports are the Personnel Summaries in HRT or Summaries / Pivot in CET.
A pivot report is a report that, by definition, groups data in one or more dimensions and must have only columns that are grouped by or that have an aggregate function (sum, max min etc...) in it's definition. There must be at least one grouping column and one aggregate column. At least on grouping column must have a pivot layout Y selected.
Apart from this, you define a pivot report with tables, select columns, conditions etc. just as any other report. Once the report has been defined, click the Generate Pivot Report checkbox and you have yourself a pivot report.
You use the Pivot Layout controls on each grouping column to select a default layout by preselecting columns that should be grouped along the X or Y axis of the grid that is the outcome of the report.
Add Chart
In order to add a chart to a non-pivot report, this option must be enabled. After having enabled it, a new component - the "Chart Settings" - will appear just below the settings component. It allows you to configure the appearance of your chart. Charting is supported by the formats HTML and PDF. Further information is available here.
Use a Distinct Select
This setting will include the SQL keyword "DISTINCT" at the beginning of the list of select columns so that each combination of select column values appears only once in the report's results.
Show Totals
When this option is switched on, a line showing the totals (sums) for all numeric select columns is shown. In order to have this option work properly at least one group column needs to be configured. Showing Totals is only meaningful in a non-pivot report because pivot reports already provide all kinds of sums automatically.
Performance checking
Built in to Information Center is a Query Performance Checker. When you try to run a query, the query will be analysed and if the results are above a certain threshold, you will be warned that your query is potentially going to be long and heavy.
At the present time, the performance checker will not block you from executing the query but bear in mind that an unnecessary and heavy query will have an impact on the performance of the database to the detriment of all users.
When the performance checker finds a dubious query it will give you the option to edit it, cancel and return to the previous page or execute it.